The spread of true and false news online
Article Info
- Authors: Soroush Vosoughi, Deb Roy, Sinan Aral (MIT)
- Publication, Year: Science, 2018
- Link to Paper
Contents
The spread of true and false news onlineArticle InfoContentsMajor FindingsLit Review and InfoDefinitionsQuantifying and Comparing Rumor CascadesCharacteristics of CascadesStatic MeasuresDetails on Collected DataFindingsAttempting to understand why falsehoods spread more oftenSummary of Findings from figure above...Quantifying NoveltyMeasuring Emotional Content of Tweet RepliesChecking the Robustness of their findings
Major Findings
- Falsehoods diffused significantly farther, faster, deeper, and more broadly than the truth in all categories of information...
- These effects were more pronounced for false political news than for false news about terrorism, natural disasters, science, urban legends, or financial information.
- False news was more novel, which suggests that people were more likely to share novel information.
- Robots accelerate the spread of true and false news at the same rate
- This implys that false news spread more than the truth because of humans spreading it not because of robots.
Lit Review and Info
Many areas of study (decision-making, cooperation, communication, markets, philosophy, etc.) consider truth to be central to nearly every human endeavor.
- Unfortunately, true and false informatio both spread rapidly on social media
"Defining truth" has become central to political strategy
Economies are affected by misinformation as well
- For example, $130 billion dollars in stock value was wiped out when Obama was said to have been injured in an explosion (this was, of course, false)
Furthermore, our response to natural disasters and terrorist attacks have all be disrupted by the spread of false news online.
While considerable attention has been paid to the anecdota analyses of the spread of false news by the media, a large-scale empirical investigation of the diffusion of misinformation and it's social origins had yet to be completed.
Most extant studies have been limited to small, ad hoc samples that ignore two of the most important scientific questions:
- How do truth and falsity diffuse differently from one another?
- What factors of human judgement explain these differences?
Del Vicario et al (2016) and Bessi et al (2015) studied the spread of scientific and conspiracy-theory stories. However, they did not evaluate these stories veracity
- "These types of stories can both be either true or false, and they differ on stylistic dimensions that are important to their spread but orthogonal to their veractiy"
To understand the spread of false news, it is necessary to examine diffusion after:
- Differentiating true and false stories for both scientific and conspiracy topics
- Controling for the topical and stylistic differences between the categories themselves
Friggeri et al (2014) analyzed ~4,000 rumors on Facebook but did not look at how falsity affects diffusion, rather they studied the affect that fact checking has on diffusion
Definitions
Fake news
The term "fake news" is explicitly avoided as the phrase has been rendered "meaningless" (in the academic sense) by politicians who use it to label new sources which do not support their positions.
- Instead, the terms "false news" and "true news" are utilized as they carry more objective verifiability
News / Rumors
News = "We define news as any story or claim with an assertion in it"
Rumor = "We define ... rumor as the social phenomena of a news story or claim spreading or diffusing through the Twitter network."
- Rumors are inherently social and involve the sharing of claims between people
- News is an assertion with claims, whether it is shared or not
Rumor Cascades
A rumor cascade begins on Twitter when someone makes an assertion about a topic.
- This can include text, photos, links to articles, etc.
- Of course, others can continue propogating this rumor, which will increase the size of the cascade
- However, cascades can exist with a size of one - which represents an claim made on twitter via a post, which was never retweeted.
Here is an example given by the authors which quite clearly illustrates how they define a rumor cascade in this study...
So, if a rumor “A” is tweeted by 10 people separately, but not retweeted, it would have 10 cascades, each of size one. Conversely, if a second rumor “B” is independently tweeted by two people and each of those two tweets is retweeted 100 times, the rumor would consist of two cascades, each of size 100.
Quantifying and Comparing Rumor Cascades
These details can be found in the supplemental materials (specifically S3, of the same title as the section here)
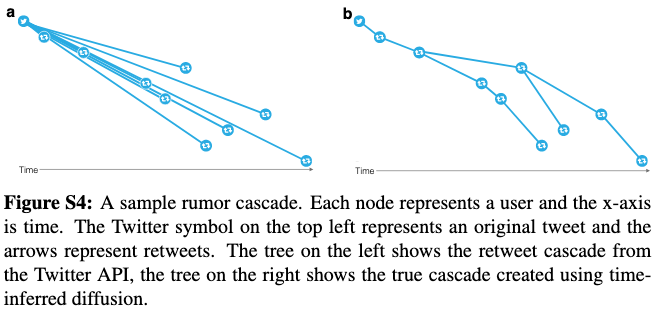
Method: Time-Inferred Diffusion
- This method is based on S. Goel, D. J. Watts, D. G. Goldstein, “The structure of online diffusion networks (2012)
- Basically what they do is they use the time stamp of the retweet in conjuction with the retweeting-user's following network to interpolate the retweet network. See the below figures for clarification on the problem as well as the solution...
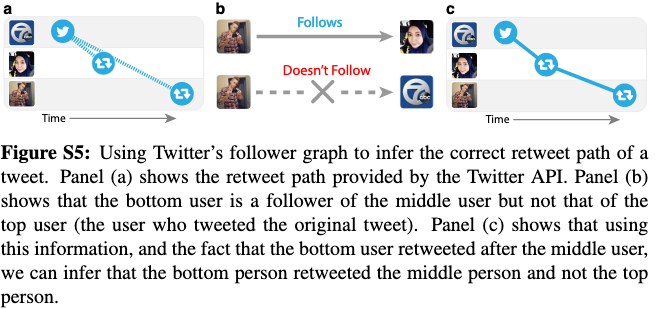
From S3.1: Time-Inferred Diffusion of Rumor Cascades
Fortunately, we can infer the true retweet path of a tweet by using Twitter’sfollower graph. Figure S5 shows how this is achieved. The left panel in the figureshows the retweet path provided by Twitter’s API. The middle panel shows thatthe bottom user is a follower of the middle user but not of the top user (the userwho tweeted the original tweet). Finally, the right panel shows that using thisinformation, and the fact that the bottom user retweeted after the middle user, itcan be inferred that the bottom user retweeted the middle user and not the top user. If the bottom user was a follower of the top user, then the original diffusionpattern shown in the left panel would stand (i.e., it would have been inferred thatboth the middle and bottom users were retweeting the top user).
Characteristics of Cascades
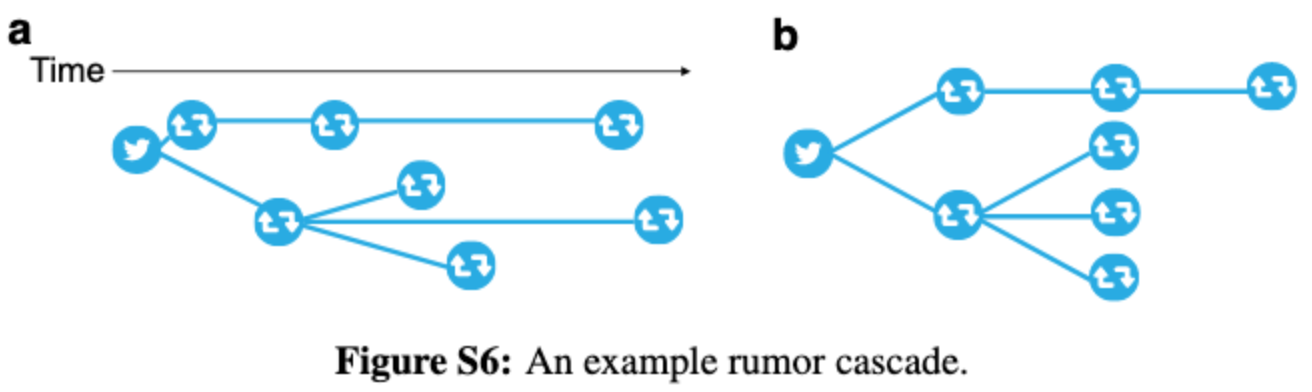
Static Measures
Since the static measures of reconstructed cascades are not dependent on time, they reorganize diffusion networks in the fashion shown below. Figure S6a shows the "true" diffusion network and S6b shows the reorganized network.
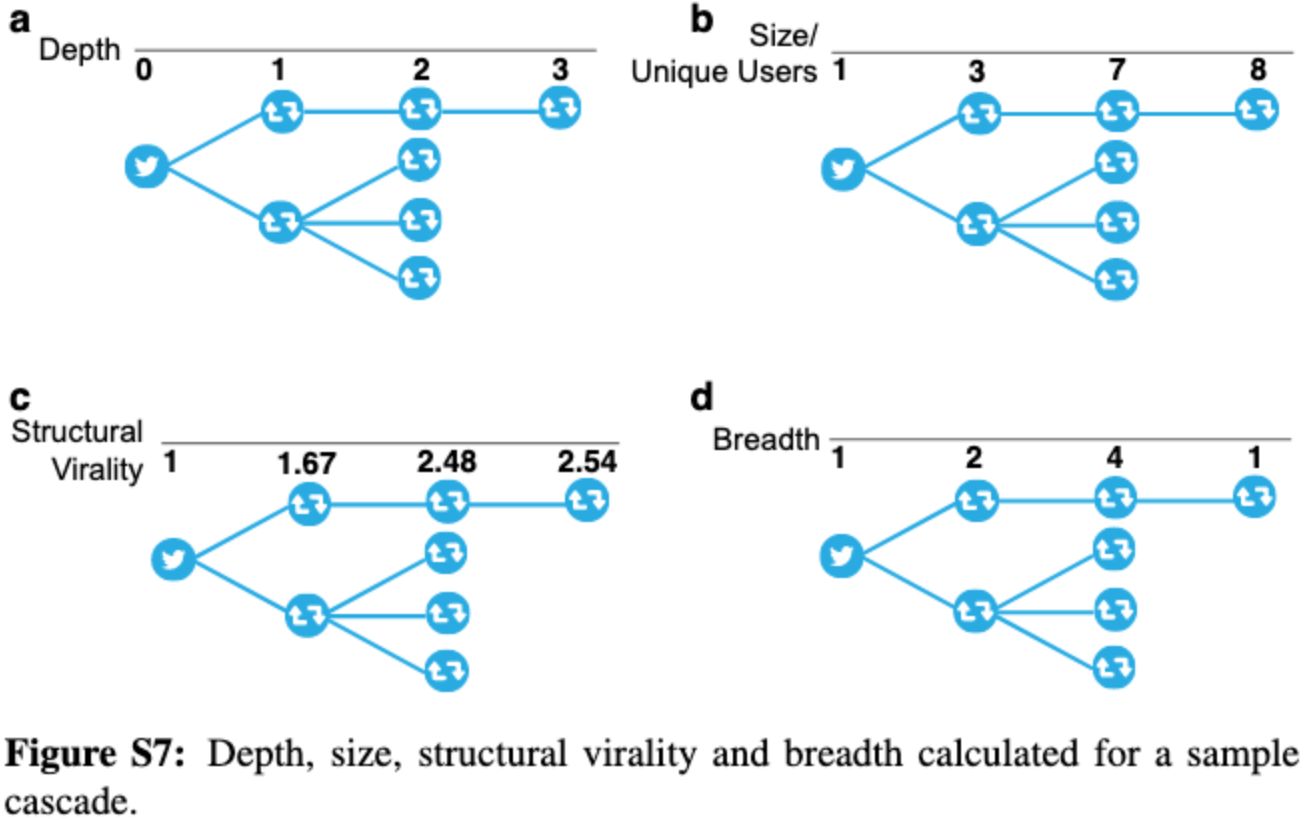
With this example they define:
- Cascade Depth: the maximum node depth in rumor cascade with nodes. Put formulaically:
where denotes the depth of node .
Cascade size: the number of unique users involved in the cascade over time.
Cascade maximum breadth: The maximum number of users involved in the cascade at any depth
- The breadth of a cascade is a function of its depth. At each depth, the breadth of a cascade is the number of nodes at that depth. As thename suggests, the max-breadth of a cascade is its maximum breadth. For a cascade with depth , the max-breadth, , is defined as:
Where denotes the breadth of a cascade at depth .
Cascade structural virality: a measure that interpolates between content spread through a single, large broadcast and that which spreads through multiple generations, with any one individual directly responsible for only a fraction of the total spread
- This can be more simply defined as the average distance between all pairs of nodes in a cascade
- Formulaically, for a cascade with nodes, the structural virality is defined as:
Where denotes the length of the shortest path between nodes and .
The figure below visualizes the calculation of each measure detailed above...
Details on Collected Data
True, False, and Mixed (partially true, partially false) news stories are examined
A comprehensive data set of all fact-checked rumor cascades that spread on Twitter from it's inception in 2006 to 2016 is utilized. This translates to...
- ~126,000 rumor cascades
- Spread by 3 million people
- More than 4.5 million times
The rumor cascades observed were taken by six independent fact-checking organizations (snopes.com, politifact.com, factcheck.org, truthotfiction.com, hoax-slayer.com, and urbanlegends.about.com)
Rumors were sampled by parsing the title, body, and verdict (true, false, or mixed) of each rumor investigation reported on their websites and automatically collecting the cascades corresponding to those rumors on Twitter
The veracity of these rumors was agreed on by these organizations 95-98% of the time
How rumor cascades were collected
Diffusion rumor cascades were cataloged by collecting all English-language replies to tweets that contained a link to any of the aforementioned websites from 2006-2017
- The idea here is that someone is responding to a tweet, and trying to correct an incorrect assertion by linking to a scopes.com or politifact.com article and using it as evidence
For each reply tweet, the original tweet was extracted and then all retweets of that original tweet were were collected
Optical character recognition (OCR) was utilized to extract text from images where needed.
Findings
Main Points:
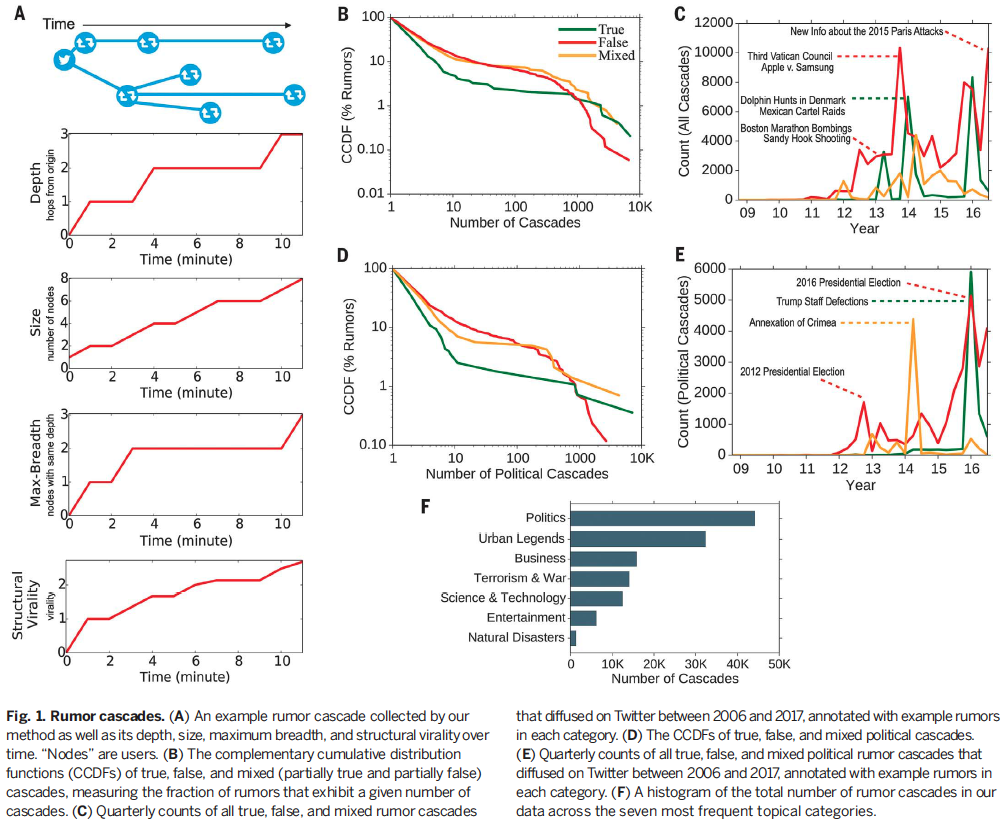
A greater fraction of false rumors experienced between 1 and 1000 cascades, whereas a greater fraction of true rumors experiencedmore than 1000 cascades (Fig. 1B)
- This was also true for political rumors (Fig. 1D)
Total false rumors peaked in 2013, 2015, and end of 2016 (around U.S. election)
Political rumors jump during the 2012 and 2016 elections
Political rumors had the largest number of cascades at ~45,000
Main Points:
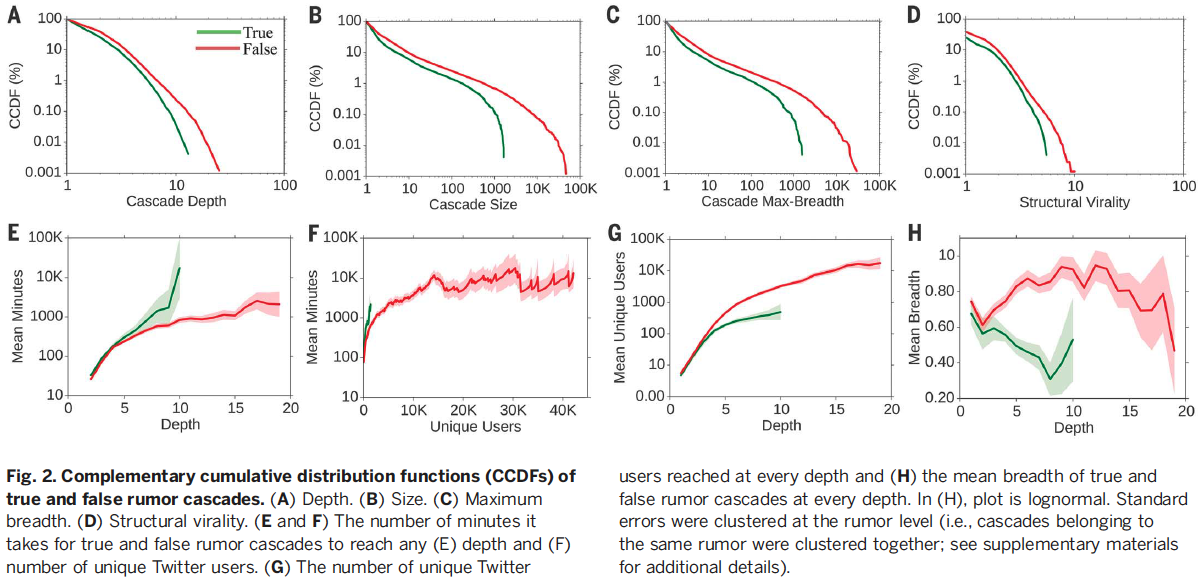
Significantly more false cascades than true cascades exceeded a depth of 10
- The top 0.01% of false cascades diffused eight hops deeper than the truth, diffusing to depths greater than 19 hops from the origin tweet (Fig. 2A).
Falsehoods reached more people than the truth
- The truth rarely diffused to more than 1000 people, however, the top 1% of false-news cascades routinely diffused to between 1000 and 100,000 people (Fig. 2B).
Falsehood reached more people at every depth of a cascade than the truth
- This means that many more people retweeted falsehood than they did the truth (Fig. 2C).
Virality aided the spread of falsehood. Thus, it did not simply spread through broadcast dynamics but rather through peer-to-peer diffusion characterized by a viral branching process (Fig. 2D).
It took the truth about six times as long as falsehood to reach 1500 people (Fig. 2F)
It took 20 times as long for truth (when compared to falsehood) to reach a cascade depth of 10 (Fig. 2E).
The truth never diffused beyond a depth of 10,
- Falsehood, however, reached a depth of 19 nearly 10 times faster than the truth reached a depth of 10 (Fig. 2E)
Falsehood also diffused significantly more broadly (Fig. 2H) and was retweeted by more unique users than the truth at every cascade depth (Fig. 2G).
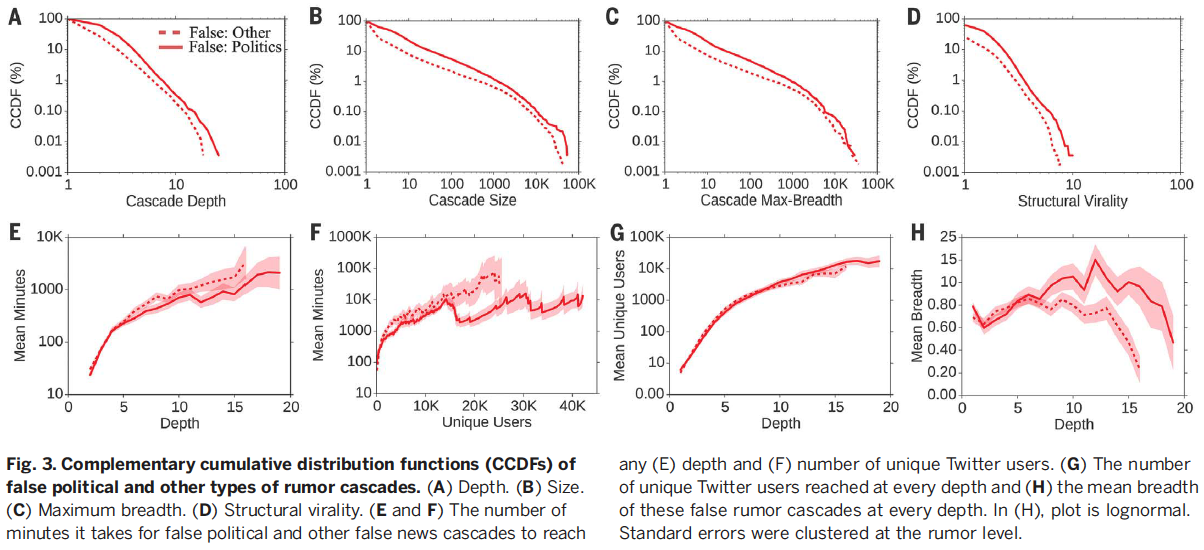
Here is the breakdown for false political vs. other cascades
Attempting to understand why falsehoods spread more often
Summary of Findings from figure above...
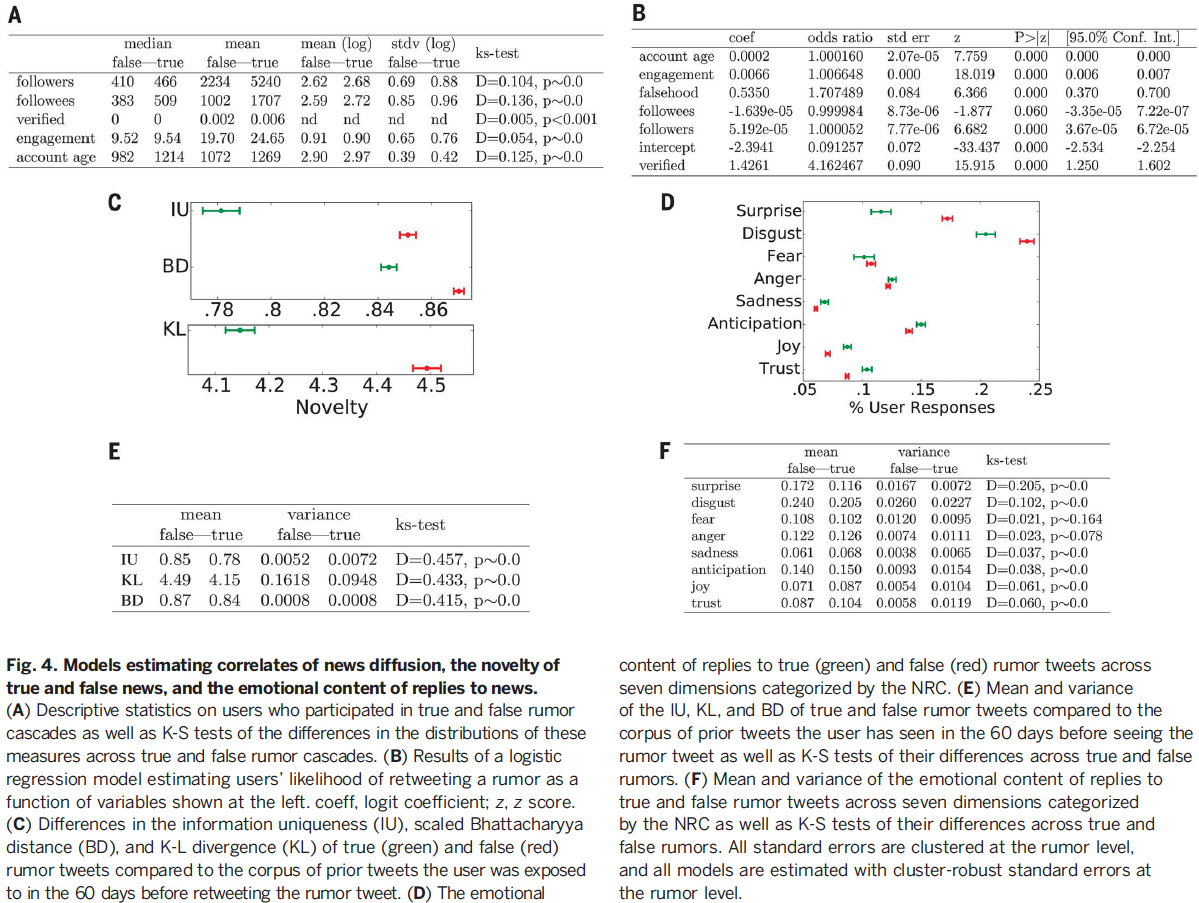
While we might assume that the network structure of users and/or their individual account characteristics would be fueling the increased spread of falsehoods. For example, they have more followers, they are verified (and thus more trusted) they are much more active, etc. - however, the opposite turned out to be true. These users responsible for spreading false news...
Had fewer followers
Followed fewer people
Were less active
Verified less often
Had been on Twitter for significantly less time
- Note: all comparisons above were found to be statistically significant by utilizing the Kolmogorov–Smirnov test.
After estimating a model for the likelihood of retweeting they found that:
- Falsehoods were 70% more likely to be retweeted even after controlling for: account age, activity level, # of followers and followers of the original tweeter, and whether or not the original tweeter was verified
Since none of the common-sense assumptions could explain the findings, they looked into information theory and bayesian decision theory - specifically, the idea that novel information is more likely to be shared. The theory can be summarized as follows:
People are attracted to novely
Novely contributes to productie decision making and encourages information sharing because it updates our understanding of the world
Novel information is surprising and more valuable from an information theory perspective (it is new information providing more aid to decision making)
- Also, it provides social status for an individual who now appears to be "in the know"
Quantifying Novelty
Randomly selected ~5,000 users who propogated true and false rumors.
Extracted a sample of ~25,000 tweets that they were exposed to in the *60 days before they retweeted a rumor
Utilize a Dirichlet Allocation Topic model, with 200 topics, trained on 10 million English words to calculate the distance between the rumor tweets and the prior tweets.
This created probability distributions over the 200 topics for each tweet (i.e. all rumor tweets and all tweets from prior to retweeting the rumor)
They found that false rumors were significantly more novel across all novelty metrics:
- Information uniqueness
- Divergence
- Chattacharyya distance (similar to Hellinger distance)
Measuring Emotional Content of Tweet Replies
In order to check whether people perceived these more novel false news tweets, they then measured the emotional content of tweet replies.
To do this, they:
Utilized a lexicon created by the National Research Council Canada (NRC) of ~140k words and their associations with
- Eight basic emotions from Plutchik's work (anger, fear, anticipation, trust, surprise, sadness, joy and disgust)
- As well as a list of ~32,000 Twitter
Stop words and URLs were removed from tweet replies
They then calculated the fraction of a tweet which included references to words attributed to the above eight emotions
- This created a vector of emotion weights for each reply that summed to one across the emotions
False rumors inspried replies expressing greater:
- surprise (supporting the novely hypothesis) as well as disgust
True rumors inspired replies expressing greater:
- Sadness, anticipation, and trust
A causal relationship between increased novely leading to more retweets is not made, however,
"... we do find that false news is more novel and that novel information is more likely to be retweeted. "
Checking the Robustness of their findings
- Checking robustness...
First, as there were multiplecascades for every true and false rumor, the variance of and error terms associated with cascades corresponding to the same rumor will be correlated. We therefore specified cluster-robust standard errors and calculated all variance statistics clustered at the rumor level. We tested the robustness of our findings to this specification by comparing analyses with and without clustered errors and found that, although clustering reduced the precision of our estimates as expected, the directions, magnitudes, and significance of our results did not change, and chi-square () and deviance () goodness-of-fit tests (, ) indicate that the models are well specified (see supplementary materials for more detail).
Checking for selection bias based on types of rumors selected by fact-checkers...
To validate the robustness of our analysis to this selection and the generalizability of our results to all true and false rumor cascades, we independently verified a second sample of rumor cascades that were not verified by any fact-checking organization. These rumors were fact checked by three undergraduate students at Massachusetts Institute of Technology (MIT) and Wellesley College. The annotators, who worked independently and were not aware of one another, agreed on the veracity of 90%of the 13,240 rumor cascades that they investigated and achieved a Fleiss’ kappa of 0.88.
Checking for bots...
We therefore used a sophisticated bot-detection algorithm (35) to identify and remove all bots before running the analysis. When we added bot traffic back into the analysis, we found that none of our main conclusions changed—false news still spread farther, faster, deeper, and more broadly than the truth in all categories of information. The results remained the same when we removed all tweet cascades started by bots, including human retweets of original bot tweets (see supplementary materials, section S8.3) and when we used a second, independent bot-detection algorithm.
Notes by: Matthew R. DeVerna