Measuring the predictability of life outcomes with a scientific mass collaboration
Authors: First Author: Matthew J. Salganik
Note: The point of this article is that many different teams of researchers (160) worked on the same problem to see what could be learned about the methods that they utilized. I am not listing them all here because it's a bit ridiculous to do so — please follow the link below to the original article to get this information.
Publication, Year: PNAS, 2020
Notes by: Matthew R. DeVerna
Measuring the predictability of life outcomes with a scientific mass collaborationOverall FindingsIntro and LitThe Common Task MethodBenefits of this methodData UtilizedFragile Families and Child Wellbeing StudyCreating the Common Task MethodOutcome VariablesPrediction DataClarification on Challenge TaskLogistics of the ChallengeUploading Predictions$R_{Holdout}^{2}$ResultsEveryone Did BadAdditional InsightsDiscussion
Overall Findings
Everyone did a really bad job at predicting life outcomes
This was despite the fact that 160 teams of researchers worked on training predictive models in many different ways
This sheds light on the potential limitations of predicting problems like this
Also it suggests that we may need to reassess life outcome predictive models and reassess the problem itself
- i.e. perhaps these kinds of problems can be more closely related to dynamic systems/chaos theory in which long-term prediction is understood to be impossible.
- Perhaps we need to learn from work on weather prediction and stock market prediction — fields in which unpredictability is a focus of study
Intro and Lit
Much has been learned about the factors that affect human life outcomes. The ability to predict individual life outcomes however is not well developed
This would be important for three reasons:
- Good predictions can be used to help families at risk
- Efforts to understand differences in predictability across social contexts can stimulate scientific discovery
- Predictive improvements can help lead to better methods and improve theory
A mass collaboration called the Fragile Families Challenge was started to utilize a method called the "common task method" to study the predictability of life outcomes
- This method is more common in machine learning
The Common Task Method
- An organizer designs a prediction task and recruits a large diverse set of researchers to tackle the problem
- The prediction models are then evaluated use the same error-metric which assess their ability to predict a set of data which has been held by the organized.
- While the structure of the prediction task is completely set — the researchers can use any prediction method/technique that they desire
Benefits of this method
- Using the Common Task Method we cannot dismiss results that are higher than expected because of concerns of overfitting or researcher degrees of freedom.
- Using the Common Task Method we cannot dismiss results that are lower than expected because of concerns about the limitations of any particular researcher or method.
- The standardization of the prediction task allows researchers to compare different methods
- More potential solutions within the problem space can be explored quickly
Data Utilized
Fragile Families and Child Wellbeing Study
Longitudinal in nature
Follows thousands of families, each of whom gave birth to a child in a large US City around the year 2000
Was designed to understand families formed by unmarried parents and the lives of children born into these families
Has been used in more the 750 published articles
Data was collected in six waves:
- Child birth
- Age 1
- Age 3
- Age 5
- Age 9
- Age 15
About the Collection Waves
- Each wave is different and, gradually, the scope of collection is increased
- For example, at birth a small survey is done with the mother but, by age nine, the survey includes interviews with the mother, the father, the Childs primary caregiver (if not the mother or father), the child's teacher, and the child. (Fig. 1)
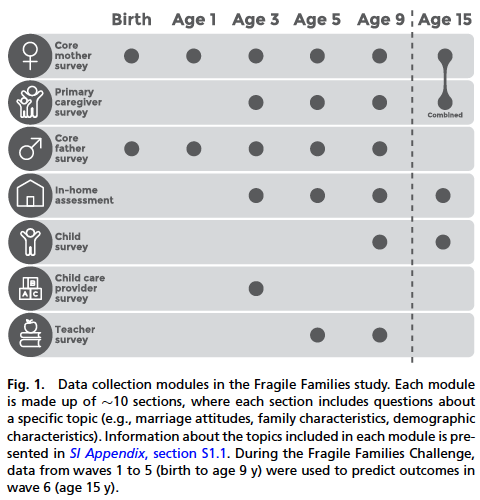
Each data collection module is made up of 10 sections and each section focuses on a specific topic (i.e., child health, father-mother relationships, marriage attitudes, etc.)
In Home Assessment
At waves 3, 4, and 5 (ages 3, 5, and 9) an in-home assessment was conducted. This included:
- Psychometric testing (i.e. Peabody Picture Vocabulary Test, Passage Comprehension Test, etc.)
- Biometric measurements (height, weight, etc. )
- Observations of the neighborhood and home
Creating the Common Task Method
The researchers created the Fragile Families Challenge to recruit researchers before the final wave (wave 6 — age 15) was available to researchers outside the "Fragile Families Team".
- This created a natural situation where only some of the data for building predictions, while withholding the rest for eventual evaluation of those prediction models.
Outcome Variables
Wave 6 (age 15) included 1,617 variables — six of these were chosen to be the focus of the Fragile Families Challenge:
- Child Grade Point Average
- Child Grit
- Household Eviction
- Household Material Hardship
- Primary Caregiver Layoff
- Primary Caregiver Participation in Job Training
Why these were selected:
- To include different types of variables (e.g., binary vs. continuous)
- To include a topics (e.g., academics, housing, employment)
- To include a variety of units of analysis (e.g., child, household, primary caregiver)
- All outcomes were based on self-reported data
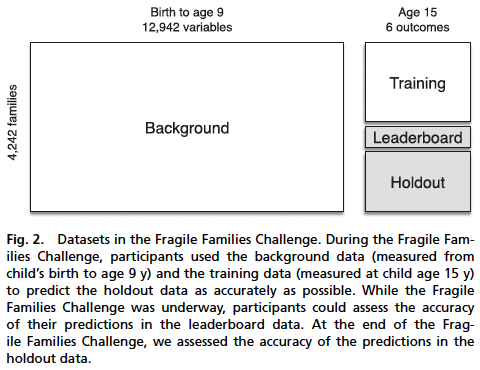
Prediction Data
Researchers were given access to a background dataset:
Included waves 1-5 (birth to age 9)
Excluded genetic and geographic information
4,292 families
12,942 variables
- The large set of variables is due to the longitudinal nature of the data and the fact that the questionnaire changes at each wave
In addition, they also had access to a smaller training dataset which included the six outcomes for half of the families (Fig. 2)
Clarification on Challenge Task
The point here was to use data from wave 1 to 5 (bird to age 9) and some data from wave 6 (age 15) to build a model that could then be used to predict the wave 6 outcomes for other families.
The task was not to predict wave 6 only from data from waves 1 through 5, which would obviously be more difficult.
The half of the data that was withheld was split into two different groups:
- Leaderboard — This dataset could be utilized to test the prediction methods while the Fragile Families Challenge was underway
- Holdout — This data was untouched until the very end by all researchers involved and then was eventually utilized to evaluate the prediction models
Error Metric Used to Evaluate All Models —> Mean Squared Error
Logistics of the Challenge
Uploading Predictions
While the Fragile Families Challenge was underway participants could upload their submissions to their website. All submissions included:
- Predictions
- Code that generated those predictions
- A narrative explaining the approach utilized
After submission, participants could see their score on a leaderboard which ranked the accuracy of all uploaded predictions against the leaderboard data.
All researchers agreed to the Fragile Families Challenge procedures, included to open-source their final submissions
To aid interpretation and facilitate comparisons across the six outcomes, all data was presented in terms of the mean squared error metric on the holdout data —>
This metric rescales the mean squared error of a prediction by the mean squared error when predicting the mean of the training data...
… is bounded above by 1 and has no lower bound. It provides a measure of predictive performance relative to two reference points.
- = 0 —> the prediction is no more accurate than predicting the mean of the training data
- = 1 —> the prediction is perfectly accurate
Results
Everyone Did Bad
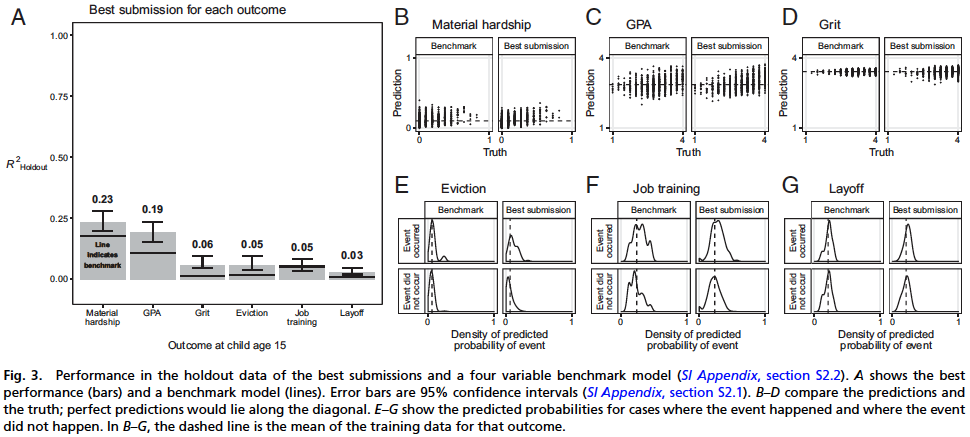
Once the challenge was complete, all data was scored against the holdout data and they learned:
Across the board, the prediction models did a very poor job
for:
Material hardship & GPA = .02
Other four variables was about .05
- (Household Eviction, Household Material Hardship, Primary Caregiver Layoff, Primary Caregiver Participation in Job Training)
Finally, they even note that their procedure (using a portion of the holdout data to train the models) would likely be slightly optimistic, so this is a very difficult problem.
Additional Insights
They also observed three important patterns within the submission data.
Teams used a variety of different data processing and statistical learning techniques to generate predictions
Despite this difference, the resulting predictions were quite similar
- For all outcomes, the distance between the most divergent submissions was less than the distance between the best submission and the truth
- Put another way, the submissions were much better at predicting each other than at predicting the truth
- This means that their attempt to create an ensemble of predictions did not deliver any sort of substantial improvement in predictive accuracy
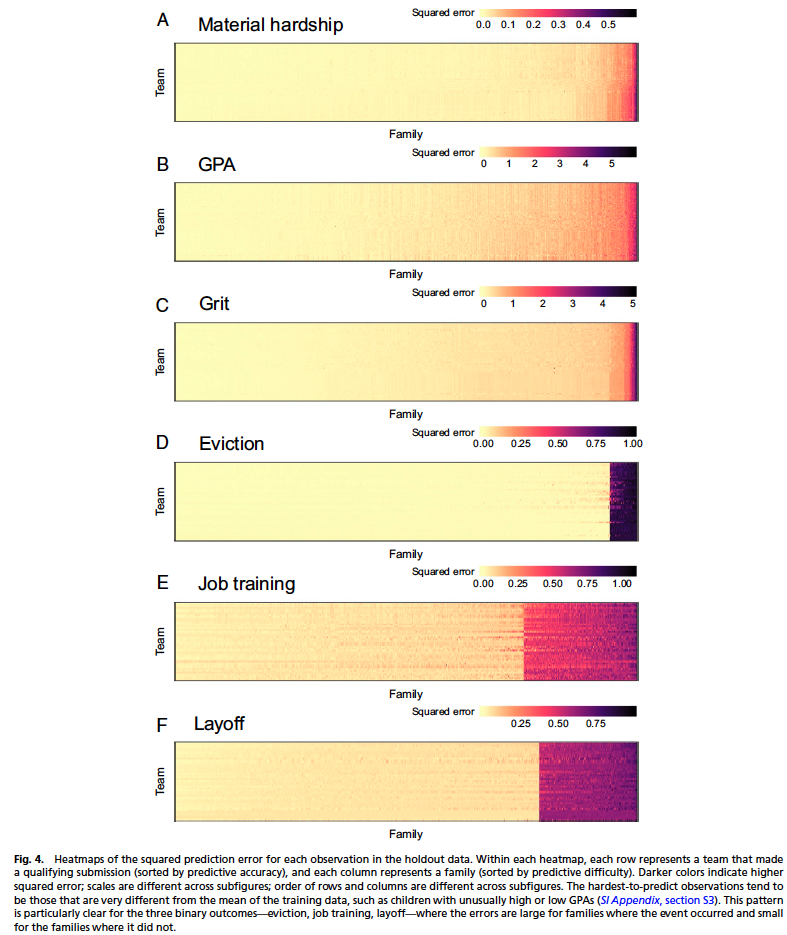
Many observations (e.g., the GPA of a specific child) were accurately predicted by all teams — yet, a few observations were poorly predicted by all teams (Fig. 4)
- As a result, within each outcome, squared prediction error was strongly associated with the family being predicted and weakly associates with the technique used to generate the prediction
Discussion
The Fragile Families Challenge speaks directly to the predictability of life outcomes in only one setting: six specific outcomes, as predicted by a particular set of variables measured by a single study for a particular group of people.
Low predictive accuracy cannot be attributed to the limitations of any particular researcher or approach
- Hundreds of people tried and hundreds of methods were utilized
Predictability is likely to vary:
- Across settings (i.e. for different outcomes)
- Over different time gaps between predictors and outcomes
- Using different data sources
- For other social groups
Regardless, they have major implications and suggest future work
For example, over 750 articles have been published with this dataset, do we think that what was learned using this data is actually valuable — give that it could not be used to predict life outcomes?
Reconciling this understanding/prediction paradox can be done in at least three ways
If prediction = understanding then these results suggest that the current understand of child development is quite poor
We could also argue that prediction does not = understanding
- For example, to understand the Black/White wealth gap we may be able to accurately describe the situation without being able to predict the wealth of an individual in the future
We could conclude that the prior understanding is correct but incomplete. It simply lacks sufficient theory to explain why we should expect outcomes to be difficult to predict — even with high quality data.
- For example, we could think about dynamic systems and chaos theory which show long term prediction to be more or less impossible
- To better construct these theories we should look to research on the weather, stock markets, etc. where unpredictability is a focus of study
Researchers making predictive models in the fields of criminal justice system and child-protective services should be concerned by these findings
- This sheds light on the potential absolute limitations on real world decision making models — not to mention the ethical concerns
Since benchmark models were not much worse than other more complex models — they suggest we should start with those and see if their predictive ability is suitable
There are many longitudinal studies taking place all over the world right now — they could all be utilized for a large-scale Common Task Method study such as this one.
Notes by Matthew R. DeVerna