The spreading of misinformation online
- Authors: Michela Del Vicario, Alessandro Bessi, Fabiana Zollo, Fabio Petroni, Antonio Scala, Guido Caldarelli, H. Eugene Stanley, and Walter Quattrociocchi
- Publication, Year: PNAS, 2016
- Link to Paper
The spreading of misinformation onlineMajor Findings Intro and Lit ReviewMethodsData CollectionPreliminaries and DefinitonsResults and DiscussionAnatomy of CascadesHomogenous ClustersThe Percolation Model
Major Findings
In this article the authors investigate (with the Facebook Graph API) how users consume information that is scientific or conspiratorial by looking at different types of Facebook groups (which are categorized within one of these two categories)
Although consumers of scientific and conspiracy stories present similar consumption patterns with respect to content, cascade dynamics differ
Selective exposure to content appears to the primary driver of content diffusion, generating homogeneous clusters — i.e. "echo chambers"
- Each echo chamber has its own cascade dynamics
They also provide a data-driven percolation model which mimics rumor spreading and shows that homogeneity and polarization are the main determinants for predicting cascade size.
Intro and Lit Review
Methods
Data Collection
To select groups, they mimic Bessi et al. (2015) and end up with:
67 public pages:
Conspiracy Theory: 32 pages
Science: 35 pages
They also gather two additional pages — which they refer to as "troll pages" — which are used as a benchmark to fit the data-driven model
These pages are include, "those pages that intentionally disseminate sarcastic false information on the Web with the aim of mocking the collective credulity online."
- These seem almost like satire pages? Or maybe extreme satire pages?
It is not entirely clear how they gather these groups, even referencing the original Bessi et al. paper, but what they say is:
Using the approach described in ref. 10, we define the space of our investigation with the support of diverse Facebook groups that are active in the debunking of misinformation.
Collect all data for a 5-year period (2010-2014) by using the Facebook Graph API
Preliminaries and Definitons
Sharing trees = the oriented successive sharing behavior of a news item on Facebook
- The root of the sharing tree is the first node that begins the tree
- The size of the sharing tree is the number of nodes within (i.e. news sharers) in the tree
- The height of the sharing tree is the maximum path length from the root
User polarization is defined as...
where is the fraction of "likes" a user gives to conspiracy-related content; hence, .
With user polarization they define the edge homogeneity, for any edge , between nodes and , as ...
With
Edge homogeneity reflects the similarity level in polarization between two nodes connected by that edge
- A link is homogenous if it's edge homogeneity is positive
- A sharing path is homogenous if the path from the root to a leaf node is homogenous for all links in that path
Results and Discussion
Anatomy of Cascades
Fig 1 shows us the sharing pattern overtime for each type of content:
- The temporal sharing patterns of both types of topics are similar
- There appears to be a first, and second peak at similar times
- The vast majority of content shared is done in the earlier few hours of a story "breaking"
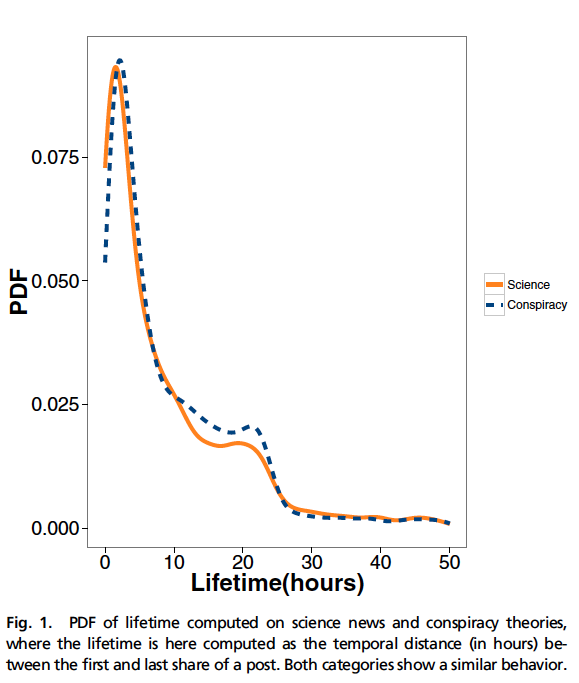
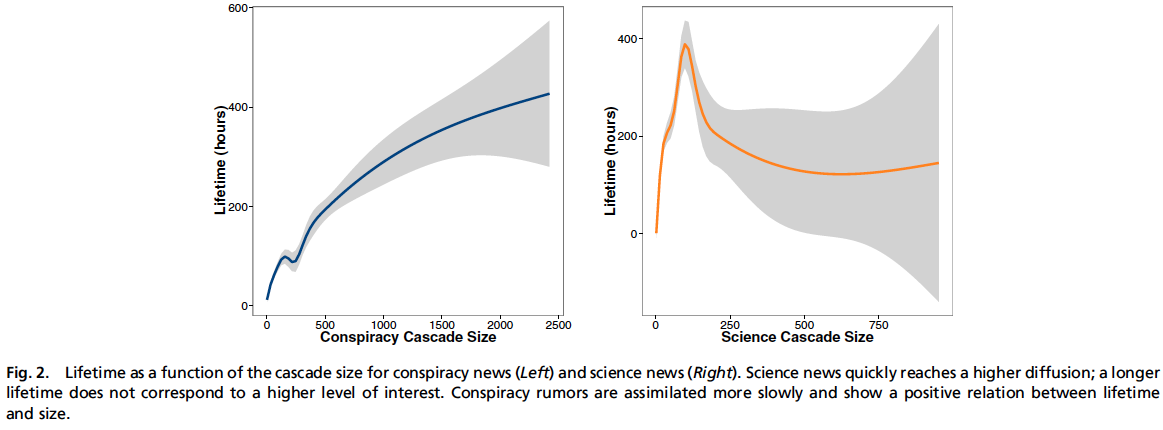
Fig 2 shows us each categories lifetime as it relates to the size of a cascade:
- Lifetime is calculated as the time between the first post and the last post in a cascade
- We can see a clear positive relationship between the cascade size of conspiracy stories and their lifetime
- Science news is assimilated quickly
- Conspiracy story topics assimilate more slowly
Homogenous Clusters
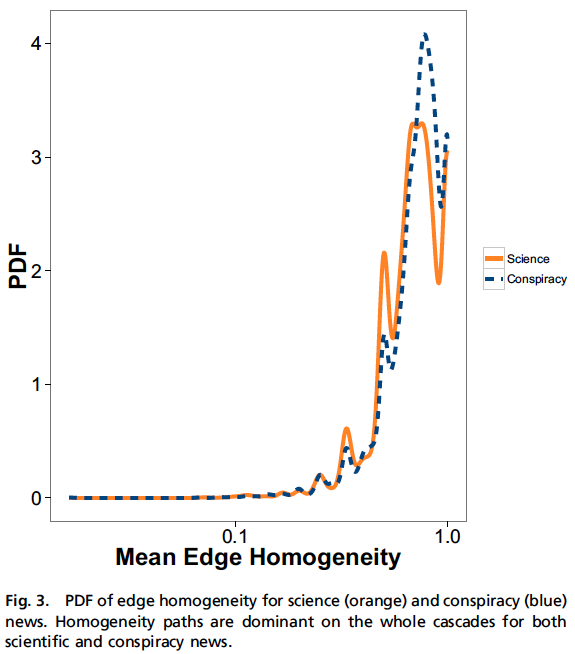
Fig. 3 plots the PDF of edge homogeneity for the mean-edge homogeneity of all cascades for each topic
- (Remember this ranges from -1 to 1, with 1 people very homogenous but anything above 0 is homogenous)
- This depicts a case where almost all content is circulated within an echo chamber
- They compute cascade size as a function of mean-edge homogeneity for both topics and see that these are homogenous as well
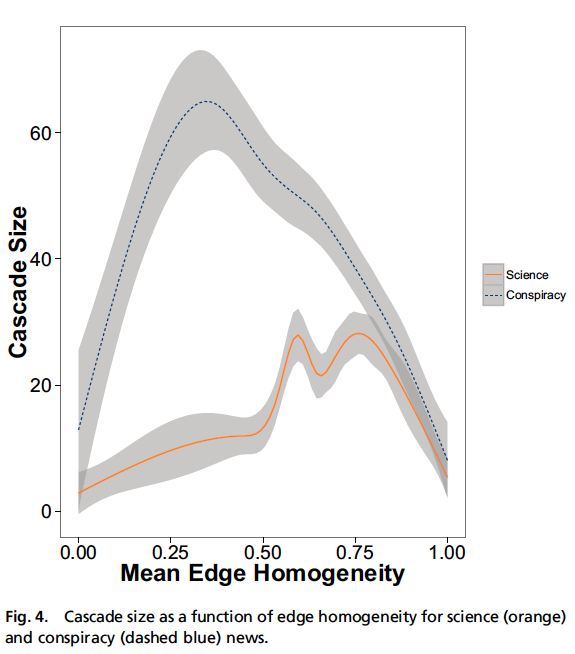
- They say...
Notice that, although viral patterns related to distinct contents differ, homogeneity is clearly the driver of information diffusion. In other words, different contents generate different echo chambers, characterized by a high level of homogeneity inside them.
I would agree with the second sentence above, but not the first. It is not clear to me that homogeneity is "clearly the driver of information diffusion." I see a relationship, but causality is up in the air here.
They also take a CCDF (complimentary cumulative distribution function) of ALL TREE PATHS compared to ONLY TREE PATHS THAT ARE HOMOGENOUS and they find that there is no statistical difference between them.
- This shows us that the vast majority of paths are homogeneous
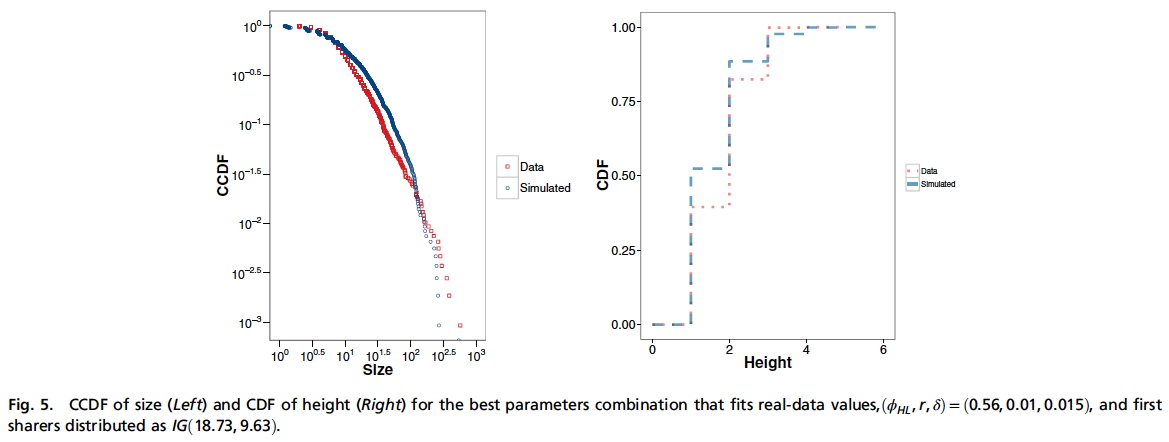
The Percolation Model
As users tend to select and share only content which agrees with a specific narrative, this suggests confirmation bias is at play
Thus they develop a percolation model of rumor spreading to account for homogeneity and polarization
- Basically the model assumes that people only share news that is close to their personal opinion
See the original text for details on the model itself, I will simply describe different ways in which they tested the model and the final conclusions
The model parameter space is tested nodes and news items.
The number of first sharers in a simulation is distributed in based on one of four different distributions:
- Inverse Gaussian
- Log normal
- Poisson
- Uniform distribution
Figure 5 shows that the inverse Gaussian is the distribution of first sharers that best fits real-world data
Notes by Matthew R. DeVerna