Twitter mood predicts the stock market
Authors: Johan Bollen, Huina Mao, Xiaojun Zeng
Publication, Year: Journal of Computational Science, 2011
Notes by: Matthew R. DeVerna
Twitter mood predicts the stock marketOverall FindingsIntroData and Methods OverviewDataPhases of Analysis1. Mood assessment2. Test Hypothesis, "Public mood is predictive of future DIJA values"3. Can existing prediction models improve DJIA prediction?Generating Public Mood Time Series: OpinionFinder and GPOMSOpinion Finder (OF)Google-Profile of Mood States (GPOMS)NormalizationCross-validating OF and GPOMS against large socio-cultural eventsNon-linear models for emotion-based stock predictionFindingsDiscussionIgnored factors / limitations:
Overall Findings
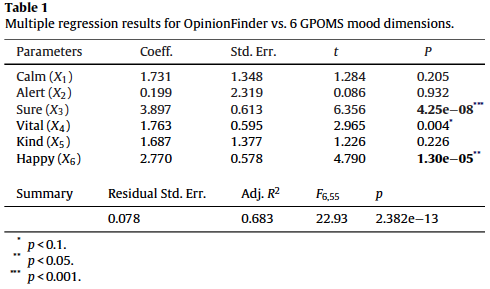
Estimating the sentiment of tweets generally — with the OpinionFinder (i.e. positive vs. negative) — as well as on 6 dimensions — via the Google-Profile of Mood States (GPOMS) — the authors find that the "public mood time series" are correlated to the Dow Jones Industrial Average (DJIA).
- Stock market predictions on the DIJA are significantly improved by including certain mood dimensions, but not others.
- Specifically, including the Calm and Happiness as measured by GPOMS seem to have a predictive effect, but not general happiness as measured by the OpinionFinder tool
Intro
Early research on stock market prediction was based on random walk theory and the Efficient Market Hypothesis (EMH)
According to the EMH stock market prices are largely driven by new information — i.e. news — rather than present and past prices.
- Since, news is unpredictable, stock market prices then will follow a random walk patter and cannot be predicted with more than 50% accuracy.
However, growing research (Socionomic Theory of Finance — aka STF — behavioral economics, and behavioral finance) shows that the stock market does not follow a random walk and can then, in theory, be predicted to some degree
Other recent research suggests that early economic and commercial indicators may be extracted from social media (blogs, Twitter feeds, etc.)
- The same may be true for the stock market
Some have shown:
- Online chat can predict book sales
- Blog sentiment can be used to predict movie sales
- Probabilistic Latent Semantic Analysis (PLSA) can be used to extract sentiment from blogs to predict product sales
- Google search queries can provide early indicators of disease infection rates and consumer spending
Others have shown:
- The relationship between breaking financial news and stock price changes
- Public sentiment of tweets can predict box office receipts
Psychological research has shown us that emotional states are crucial for decision making as well and may reasonably affect stock market decisions as well
- Behavioral finance plays a large role in this as well
It is therefore reasonable to assume that the public mood and sentiment can drive stock market values as much as news.
Data and Methods Overview
Data
~9.853 million tweets
~2.7 million users
Stop words and punctuation are removed, and tweets are grouped by the date they were submitted
Only tweets which include explicitly statements of the author's mood state are included
- i.e. — "I feel", "I am feeling", "I'm feeling", "I don't feel", "I'm", "im", "I am", and "makes me"
In order to avoid spam messages and other information-oriented tweets, they remove tweets that include "http:" or "www."
Time series of daily DJIA closing-values from Yahoo! Finance
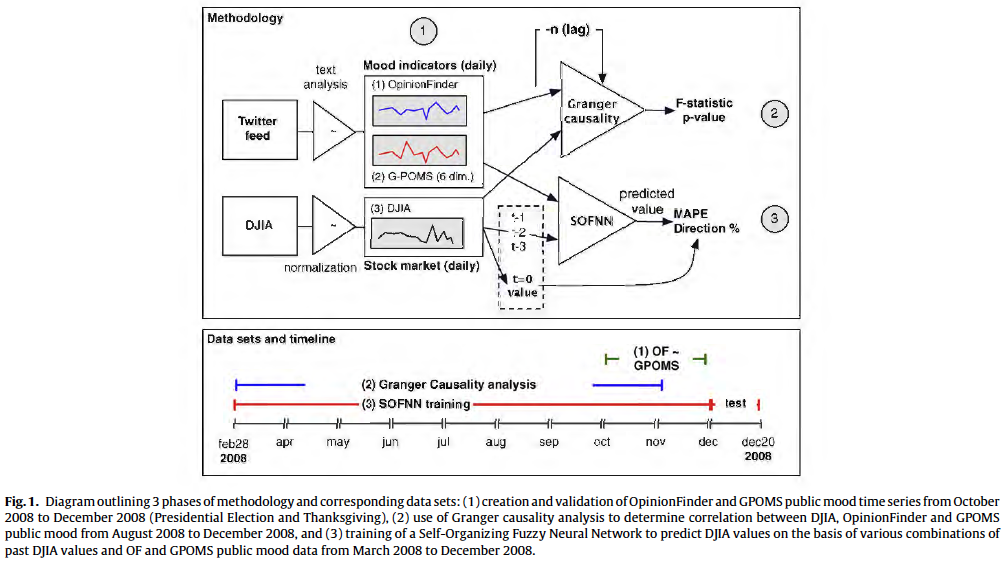
Phases of Analysis
1. Mood assessment
All tweets are subjected to the mood assessment tools:
- OpinionFinder —> Positive vs. Negative mood
- GPOMS —> Calm, Alert, Sure, Vital, Kind, and Happy
- This provides 7 measures of mood in total
2. Test Hypothesis, "Public mood is predictive of future DIJA values"
- Use Granger causality analysis in which they correlated DJIA values to GPOMS and OF values of the past n days.
3. Can existing prediction models improve DJIA prediction?
- Deploy a Self-Organizing Fuzzy Neural Network model
- They are not interested in proposing an optimal DIJA prediction model, but to assess the effects of including public mood information on the accuracy of a "baseline" prediction model
Generating Public Mood Time Series: OpinionFinder and GPOMS
Opinion Finder (OF)
Determines sentence-level sentiment
Has been shown to correlate with the Consumer Confidence Index from Gallup and the Reuters/University of Michigan Surveys of Consumers over a given period of time
Using the OF lexicon , they select works that are marked as "weak" or "strong" which results in:
- 2718 Positive and 4912 negative words
They then calculate the number of positive and negative words in a tweet
- For each occurrence they increase the score of negative or positive tweets by 1 (two scores)
- Then calculate the ratio of messages on day t (for all days)
This tool operates on a unidimensional model of mood so they use GPOMS for more detail...
Google-Profile of Mood States (GPOMS)
Measures human mood states in terms of 6 different mood dimensions: Calm, Alert, Sure, Vital, Kind and Happy
Derived from a well-vetted psychometric instrument —> the Profile of Mood States (POMS-bi)
- See also, J.C. Norcross, E. Guadagnoli, J.O. Prochaska, Factor structure of the profile of mood states (POMS): two partial replications, Journal of Clinical Psychology 40 (5) (2006) 1270–1277.
Enlarged the existing 72 terms from the POMs questionnaire by analyzing word co-occurrence in a collection of 2.5 billion 4- and 5- grams computer by Google in 2006 from ~1 trillion word tokens taken from public webpages
This enlarged the lexicon to 964 terms to create a wider variety of naturally occurring mood terms in Tweets then mapping the associated mood to those terms
- Each tweet that matches an n-gram term is mapped back to its original POMS term (in accordance with its co-occurrence weight)
The score of each POMS mood dimension is thus determined as the weighted sum of the co-occurrence weights of each tweet term that matched the GPOMS lexicon
Normalization
- To create a common scale for comparisons of the OF and GMPOs they normalize each score to a standard z-score on the basis of a local mean and standard deviation within a sliding window of k days before and after a particular date...
For example, the z-score of time series , denoted is defined as:
Where and represent the mean and standard deviation of the time series within the period .
- This causes all fluctuations to happen around a zero mean and be expressed on a scale of 1 standard deviation
The mentioned z-score normalization is intended to provide a common scale for comparisons of the OF and CPOMS time series. However, to avoid so-called "in-sample" bias, we do not apply z-score normalization to the mood and DJIA time series that are used to test the prediction accuracy of our Self-Organizing Fuzzy Neural Network. This analysis and our prediction results rest on the raw values for both time series and the DJIA.
Cross-validating OF and GPOMS against large socio-cultural events
- To validate these tools, they observed how they behaved during two events, US Presidential Election Day (2008) and Thanksgiving
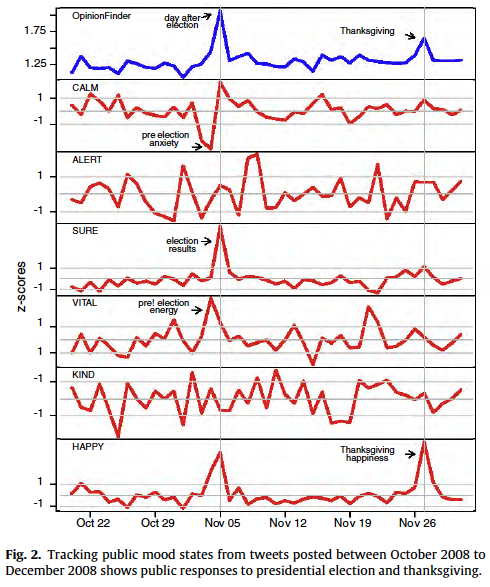
- These models appear to do a solid job of picking up the mood during these events
- How sub-scores of GPOMS correlate to the OF scores
OF seems to correlated significantly with the Sure and Happy dimensions of GPOMS, but certainly offers a unique perspective on public mood states beyond a uni-dimensional tool like OF, with the other dimensions
Bivariate Granger Causality Analysis of Mood vs. DJIA Prices
This analysis rests on the assumption that if a variable X causes Y then changes in X will systematically occur before changes in Y.
- Thus, we will find that the lagged values of X will exhibit a statistically significant correlation with Y
Correlation however, does not prove causation. We therefor use Granger causality analysis in a similar fashion to 1 ; we are not testing actual causation but whether one time series has predictive information about the other or not.
DJIA time series is defined as
—> aka the change in price from day to
They create two models for prediction:
- —> Using only lagged values of the
- —> Using lagged values of plus the values from GPOMS and OF
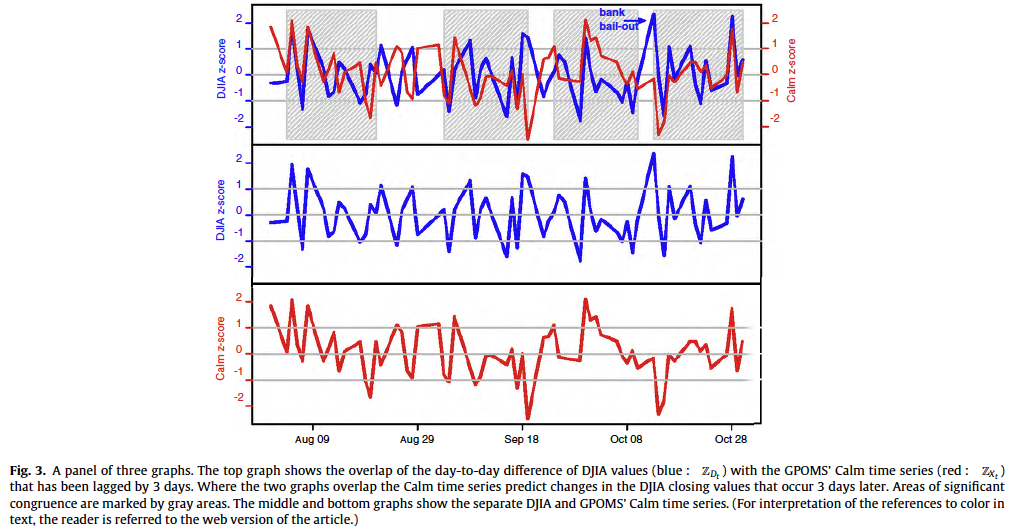
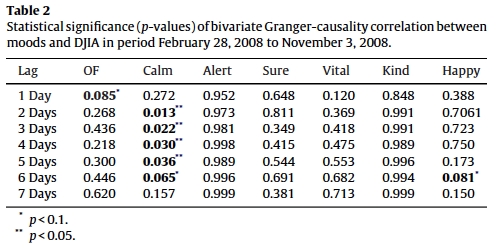
Based on the results of our Granger causality (shown in Table 2), we can reject the null hypothesis that the mood time series do not predict DJIA values, i.e. with a high level of confidence. However, this results only applies to 1 GPOMS mood dimension. We observe that (i.e. Calm) has the highest Granger causality relation with DJIA for lags ranging from 2 to 6 days (-values<0.05). The other four mood dimensions fro GPOMS do not have significant causal relations with changes in the stock market, and neither does the OpinionFinder series.
Non-linear models for emotion-based stock prediction
Now they try prediction with a self-organizing fuzzy neural network (SOFNN) model
- SOFNN combines the learning ability of neural networks with he may interpretability of fuzzy systems
- SOFNN has been developed specifically for regressions, function approximation and time series analysis problems
- Provides an efficient algorithm for online learning due to its simple and effective parameter and structure learning algorithm
To predict the DJIA value on day , the input attributes of the SOFNN include combinations of DJIA values and raw mood values of the past days (not normalized to z-scores)
is chosen based on results from Table 2
Historical load values are linearly scaled to [0,1]
- This gives all values equal importance
SOFNN models require the tuning of a number of parameters, these parameters are kept constant across all input combinations to ensure an unbiased comparison of model performance
It is possible that other mood dimensions beyond Calm are useful when combined with Calm, so they try all different types of combinations — 7 permutations to be specific.
- ...
Represents the DJIA values and represents the values of the GPOMS mood dimensions 1, at time , , and . According to the same notation represent combination of historical DJIA with mood dimensions 3, 4, 5 and 6 at time , , and . For example, represents a set of inputs that includes the DJIA values , , and , and mood dimensions 1 and 6 at the same times.
Forecasting accuracy is measured in terms of:
- Average mean absolute percentage error (MAPE)
- Direction accuracy (up or down) during the test period (Dec. 1 to Dec. 19, 2008)
Findings
They find (table 3):
Using the OF has no effect on prediction
That combining Calm and Happy within the SOFNN model leads to a significantly reduced mean absolute percentage error (MAPE), which is surprising because Happy does not have a good Granger causality relation with DJIA given a lag of .
- This result does not appear to be the result of chance after conducting a few small probability tests (see original text, pg. 6)
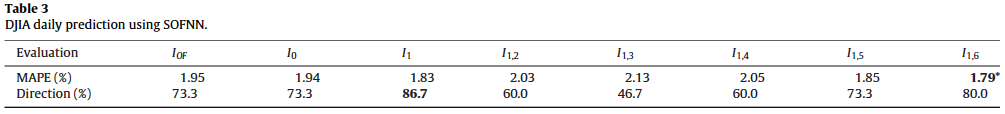
Given finding #2 above, they then try to do a linear prediction by combining Calm and Happy scores () and find the prediction to be worse than using Calm alone.
- This leads them to conclude that the relationship between different dimensions is non-linear
Discussion
Improving prediction of the DJIA — analyzing large-scale twitter feeds for public mood indicators — appears to be possible.
- Interestingly, only the "calmness" (as measured by GPOMS) appears to be granger causative.
- Using the self-organizing fuzzy neural network trained on the basis of past DJIA values and public mood offers statistically significant improvement
More sophisticated market models should improve on this relatively simple approach
Using Twitter data for this type of task has many advantages over using similar "classic" methods like self-reported well being surveys
- Faster, more flexible, cheaper, etc.
Ignored factors / limitations:
- Not designed to limit the analysis by geographical location
- Though some form of cross-validation was conducted on the mood measurements, there is no knowledge of "ground truth" for public mood states so there is a leap of faith being taken here
- There is no causative mechanism connecting online public mood states with DJIA values addressed in this study, despite the correlation between public mood states and Twitter feeds that is shown.
This may mean that the market can correct itself more quickly because information spreads faster nowadays.
- On the other hand, the market may be more affected by misinformation
Because this type of information is available to professional traders, this puts the average trader at an increased disadvantage and may increase market volatility
- As a result, we may see greater market stability but one that is punctuated by significant bursts caused by "social contagion" effects.